Know More
For Those Who Are Aware
One chart and one story about your money. Listed newest first. Tap an issue title to read the full text.
Know More, Issue 2 Issue 2: The U.S. Now Pays More in Interest Than on Defense
Know More
For Those Who Are Aware
Issue 2: The U.S. Now Pays More in Interest Than on Defense
This week's chart: federal interest payments vs. national defense spending, 1990 to 2026 Q3. Sources: U.S. Bureau of Economic Analysis via FRED, federal interest payments (https://fred.stlouisfed.org/series/A091RC1Q027SBEA) and national defense consumption and investment (https://fred.stlouisfed.org/series/FDEFX).
The house on the hill
Picture a village where one man owns the largest house on the hill. Each year he pays a few guards to walk his fence at night, and each year he borrows a little from the lender at the bottom of the road to cover what his harvest does not. The loans are easy to take. The payments are small at first, smaller than the wages of a single guard.
Seasons pass. The borrowing never stops, and the payments grow quietly beside it. One winter the borrower counts his coins and finds something strange. He now sends more silver down the road to the lender than he spends guarding his own house.
The fence is still walked. The house still stands. Even so, the largest steady payment leaving that house no longer protects it. It goes to the person who holds the paper.
In a village that runs on debt, the quiet one with the ledger is the one who gets paid first.
The lender, meanwhile, does nothing dramatic. He keeps his ledger, collects on schedule, and lends again.
Get Know More by email
One chart and one story about your money, sent to your inbox.
Talk to MaxThe crossing in the federal record
The federal record now shows the same crossing.
- 2026 Q2: federal interest payments ran at $1,279.7 billion a year, while national defense spending ran at $1,189.9 billion, both seasonally adjusted annual rates from the Bureau of Economic Analysis.
- 2026 Q3: the gap widened, with $1,328.8 billion in interest against $1,233.2 billion for defense.
- 2024 Q1: interest first passed defense in this data, at $1,062.8 billion against $1,039.1 billion, and has stayed above it every quarter since.
- Before that, the last time interest topped defense was a single quarter in 1998.
- As recently as early 2010, interest was $360.3 billion and defense was $817.5 billion.
Sources: https://fred.stlouisfed.org/series/A091RC1Q027SBEA and https://fred.stlouisfed.org/series/FDEFX. Recent quarters are early estimates and may be revised.
Where the interest goes
Every dollar of that interest lands somewhere. It goes to whoever holds the government's bonds: pension funds, insurers, foreign governments, the central bank, mutual funds, and individual savers holding Treasury securities directly.
A country that borrows becomes, by arithmetic, a country with a growing class of people and institutions it must keep paying, year after year.
Which side of the ledger are you on?
That is the lesson worth seeing clearly. Debt is never only a burden. On the other side of every borrower stands a lender, and the payment that weighs on one side is income on the other.
On the other side of every borrower stands a lender.
For a saver, the useful question is not whether the borrower is right or wrong. It is which side of the ledger your own money sits on, who is paying you, who you are paying, and how much of your own budget already flows down the road in interest.
For the comments: In your own household, does more go down the road to lenders, or come back up it?
Talk it through with Matthew
Book a free Google Meet with Matthew Halfacre.
Book a free Google Meet with Matthew Halfacre
Talk to Max free at halfacreresearch.tech.
Know more. Bank less.
Research and education only. Not investment, tax or legal advice, and not personalized to you. You decide. Halfacre Research.
Halfacre Research is not registered as an investment adviser with the SEC or any state, and no adviser-client relationship is created by reading this or booking a call.
Get the next issue
One chart and one story about your money, sent to your inbox.
Talk to Max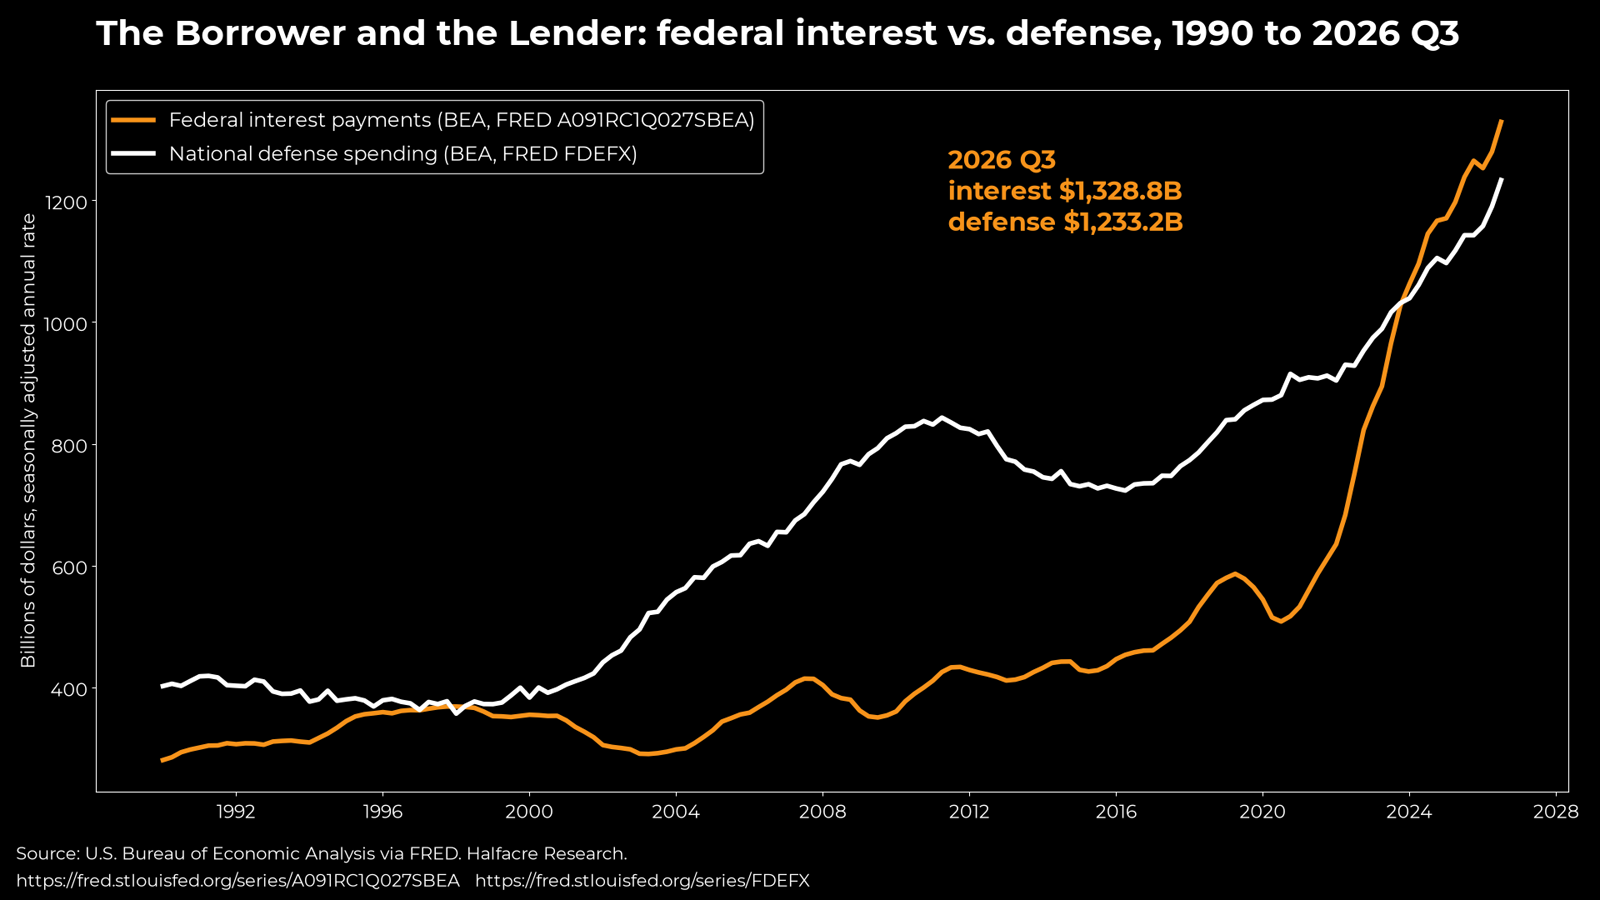
Know More, Issue 1 Issue 1: What a 1913 Dollar Buys Today

Know More
For Those Who Are Aware
Issue 1: What a 1913 Dollar Buys Today
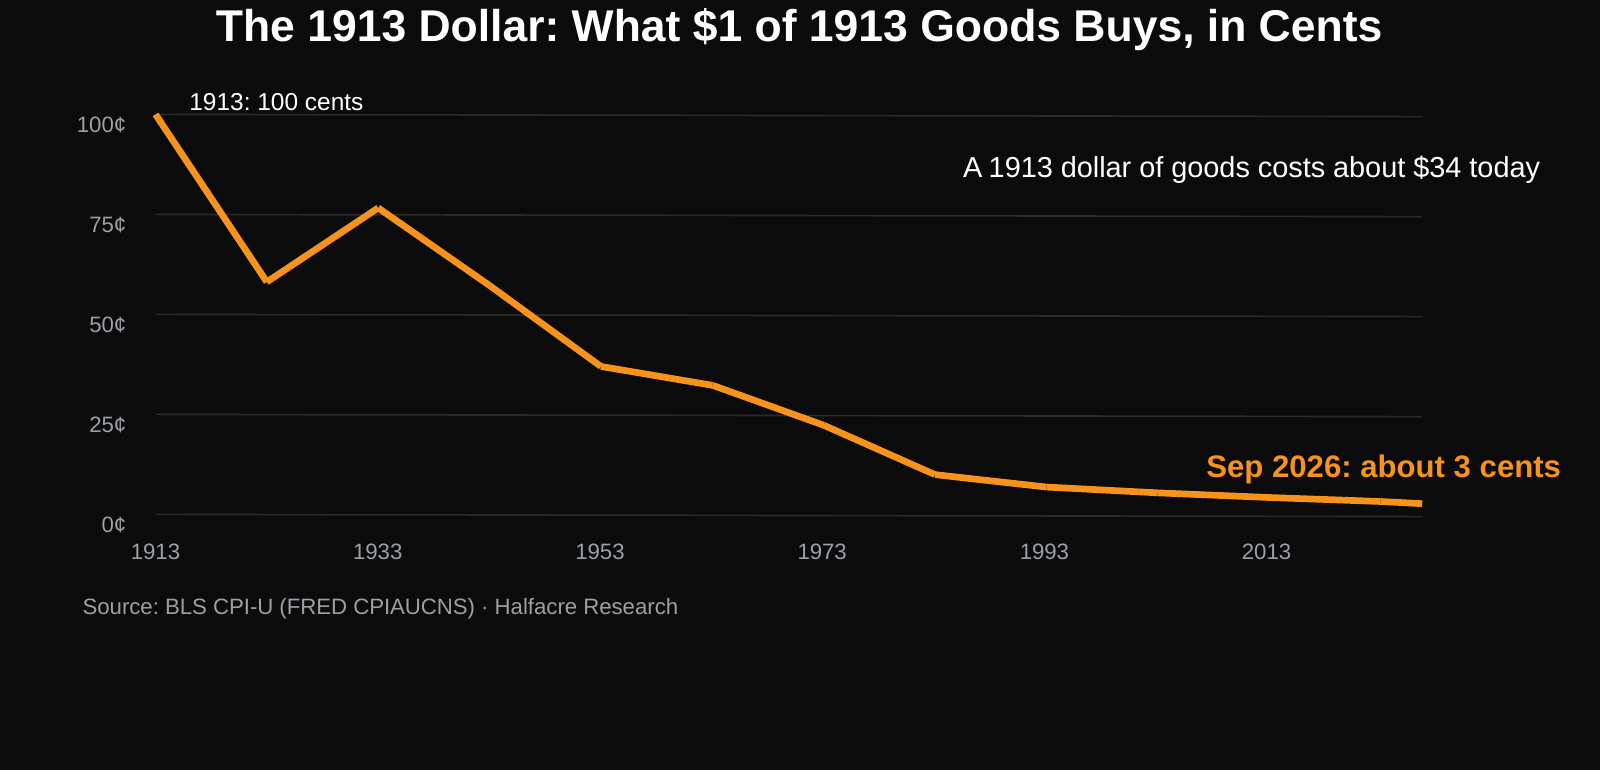
This week's chart: the Consumer Price Index (CPI-U), 1913 vs. September 2026. Source: U.S. Bureau of Labor Statistics.
A farmer once carried his grain to market in an old sack. Every season he filled it to the brim, slung it over his shoulder, and walked the long dirt road into town. Every season, when the buyer set the sack on the scale, it weighed less than he had packed. He blamed the scale. He blamed the buyers. He blamed the dry wind off the fields. He worked longer, packed tighter, and walked faster. Still, he arrived short.
One morning his daughter walked a few steps behind him. Halfway to town, she stopped him and pointed back down the road. A thin golden line of grain stretched through the dust all the way back to the farm. At the bottom of the sack was a small tear. It was too small to see from the top and too slow to feel on his shoulder, but over enough miles it was wide enough to spill a lifetime of harvests onto the road. The farmer never needed to work harder. He needed to see the tear.
Get Know More by email
One chart and one story about your money, sent to your inbox.
Talk to MaxThe dollar has a tear of its own, and the official record shows how wide it has grown. In 1913, the year Congress created the Federal Reserve, the Consumer Price Index stood at 9.9. In September 2026, it stood at 336.94. That is the Bureau of Labor Statistics' own measure of what everyday goods cost. The math is simple: a 1913 dollar now buys about 3 cents' worth of what it once did. Put another way, it takes about $34 today to buy what $1 bought then.
Like the farmer's grain, the loss never came all at once. No single year emptied the sack. It leaked a little at a time, mile after mile, and that is exactly why no one noticed. A sudden loss demands an answer. A slow one is easy to blame on the scale, the buyers, or the weather, while the real cause trails quietly behind you.
That is the trap of measuring progress only in dollars. The balance on your statement is the weight you packed at the start of the road. What matters is the weight that reaches the scale: what that money can actually buy when you need it. A number can grow every year while the grain keeps leaking out. For families building savings and institutions managing reserves alike, the real question isn't how full the sack looks at the start. It's how much will be left at the end of the road, and whether the sack itself is sound.
For most of the last century, only institutions and the wealthy had the research teams and the time to study that question seriously. Everyone else got a statement and was told a rising number meant progress. AI changes that. Now anyone can have a research partner that walks behind the sack, spots where the grain is slipping, and explains the options in plain language, while every decision stays with the person who owns the harvest.
For the comments: If you walked a few steps behind your own savings, where would you find the tear?
Talk to Max free at halfacreresearch.tech.
Know more. Bank less.
Get the next issue
One chart and one story about your money, sent to your inbox.
Talk to Max